


Housing Market Update
by: Macro Minutes


“The sources of deflation are not a mystery. Deflation is in almost all cases a side effect of a collapse of aggregate demand… a drop in spending so severe that producers must cut prices on an ongoing basis in order to find buyers.”
-- Ben Bernanke
A quick google search will give you mixed results on where the housing market is headed in 2023. Reports range from “15% more down” to “The housing market might be nearing the bottom” to “The housing market has started to recover”. One thing is clear, there isn’t much agreement on where things are headed in the mainstream and while a lot of people are talking about signs of a potential bottom / recovery, the defensive positioning of the nation's largest home builders is signaling rough waters ahead.

Asset prices are determined at the margins, only the actions of those who need to buy and sell an asset are setting the price at any given time. Your 2.5% 30 year mortgage is meaningless to what’s happening in your neighborhood now and has little impact on the price that newly built homes in that neighborhood will actually close at. This means that the companies on the sell side of housing are something that should be watched closely if you want to understand where the market may be headed.
In D.R. Hortons 2023 first quarter earnings report they expect both their average sales price and home sales gross margin to decrease further in the second quarter of 2023.

They have also begun to offer things like rate buy downs to offer lower than market rates to potential home buyers. Incentives like this mean that home builders have to take a hit to their own balance sheet to keep demand up.
Another thing to look at for these large companies is Cancellation rates. As seen in the quote above, cancellation rates have doubled compared to the same quarter last year for D.R. Horton. KB homes were even worse with cancellation rates at 68% compared to their baseline of 13%. In 2008 cancellation rates increased before prices fell, and they peaked around 50% across all home builders.
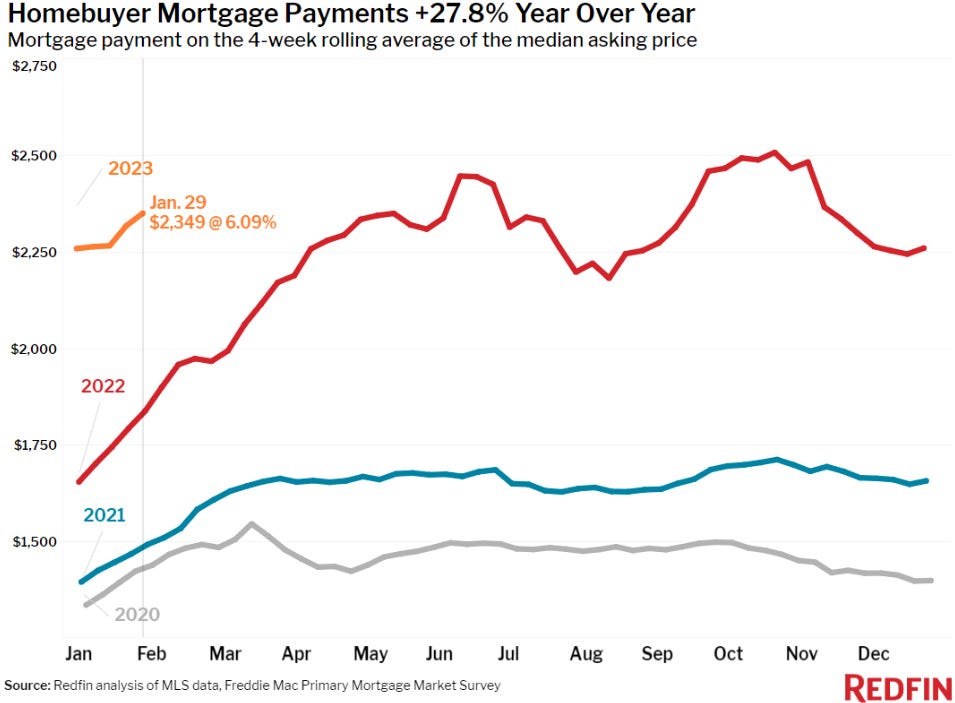
If you look at the payments people are making after purchasing a home it becomes clear why cancellation rates are on the rise. The average homebuyer in 2023 will be paying nearly 3x 2020 levels if prices don’t come down.
The only way this could possibly be sustained is if people are getting pay increases at faster rates than have ever been seen in US history or families will have to allocate the majority of their monthly income to a mortgage, meaning they will have to lower their quality of life in other areas in order to afford a home.
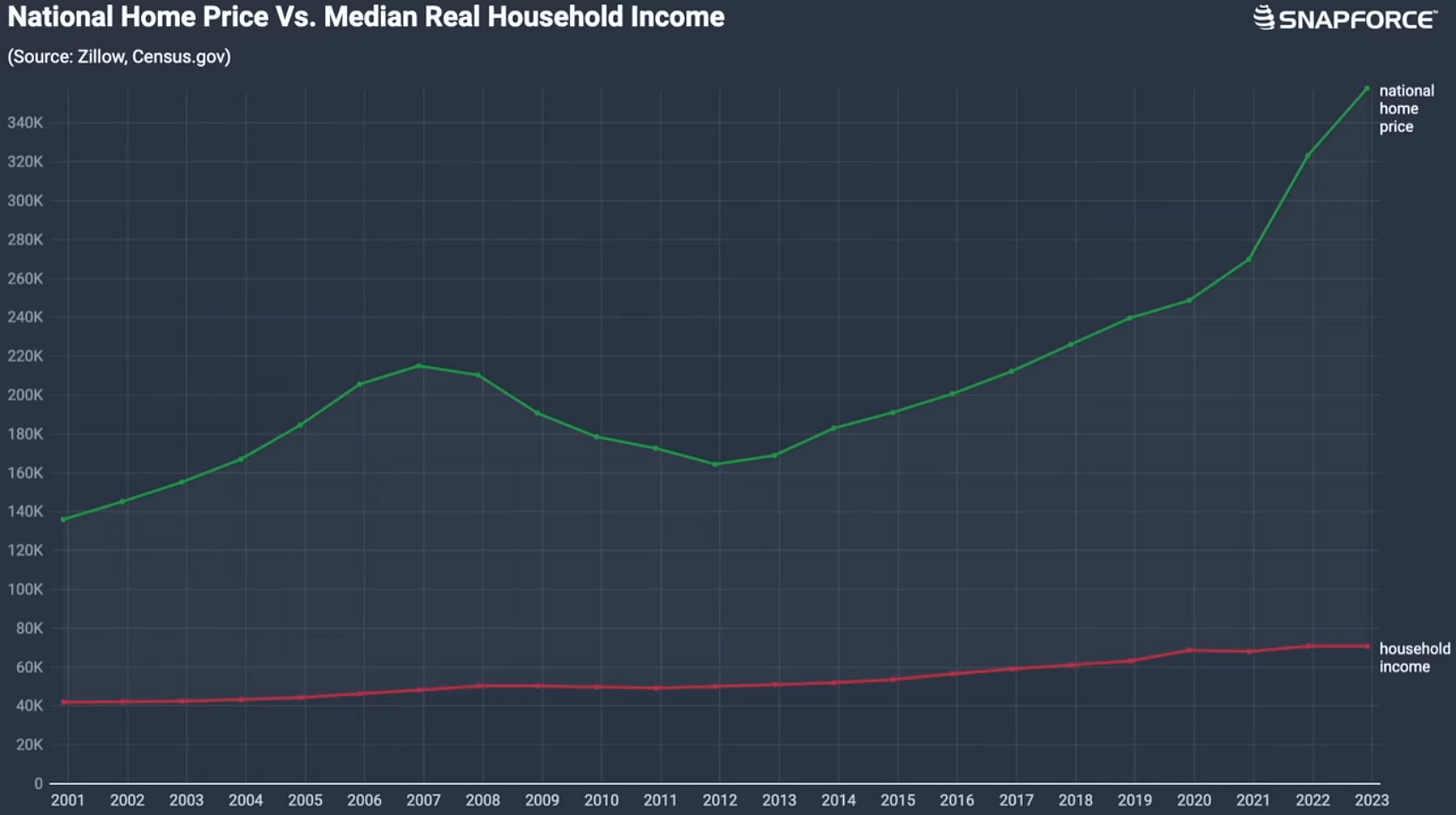
Home price vs median household income is the best way to track housing affordability. Even with the recent cooldown last year we are still at historical highs for this very important metric. This means even if rates come down in 2023 there are major headwinds for the housing market.
All of this hinges on what the Federal reserve does, the longer they hold interest rates high the more likely we are to see a significant slowdown in the housing market. With rates the highest they have been in almost 15 years and the Fed signaling that they plan to keep rates high for the majority of 2023 it seems that an environment of elevated rates will continue for the foreseeable future. Because of this we argue that the likely path forward for the next 12-24 months is for prices to come down which should give pause to anyone considering buying a home in the next 12 months.

Now let's talk about bitcoin.
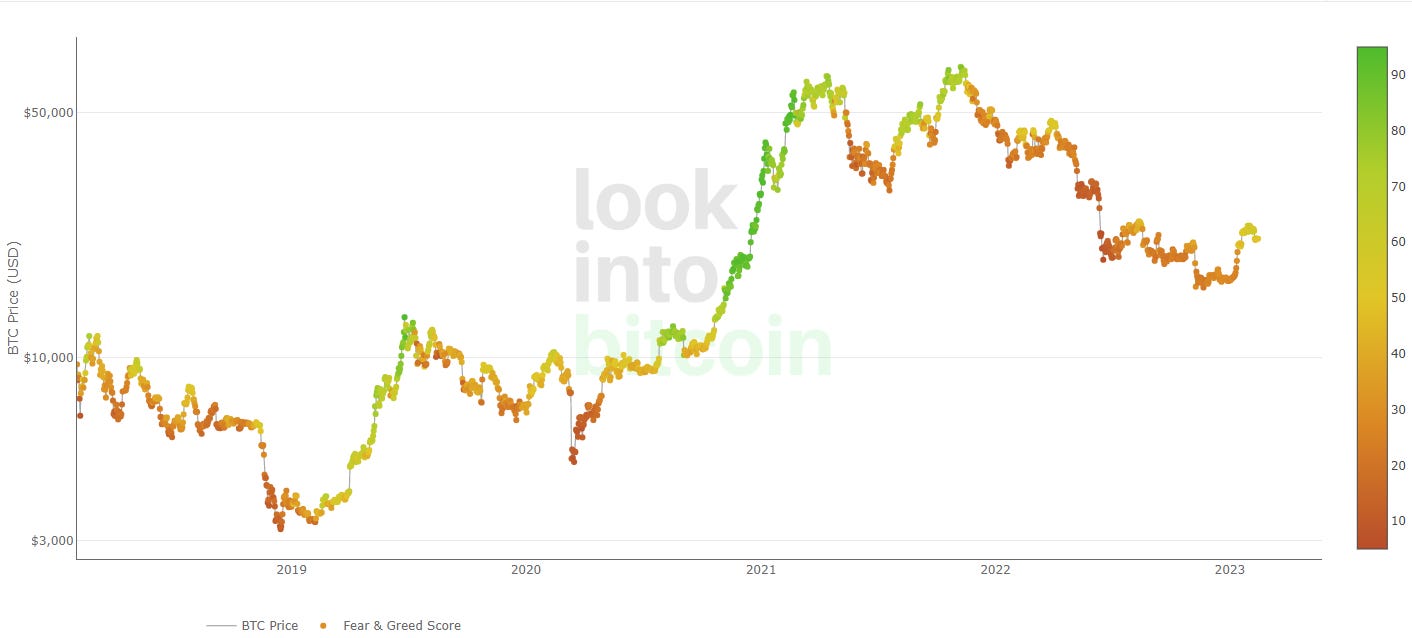
It should come as no surprise to anyone reading this in Feb 2023 that were down big from the Nov 2021 highs of nearly $70,000. Bitcoin is down more than 70% from that time frame and has found a recent floor around $16,000. This is in sharp contrast to housing which is just coming off of its peak in many areas and potentially has a long way down to go yet as was discussed above.

Another key metric shown in the chart above is the 1yr HODL wave. This is simply the amount of BTC that hasn't moved in over 1 year. This metric is useful if you want to get an idea of what percentage of BTC is currently being held by people with strong hands. It tends to bottom when BTC price runs hot and peaks prior to upward price action. We are currently at all time highs for the 1yr HODL wave, this puts upward pressure on price because those marginal buyers are forced to buy from an ever shrinking pool of bitcoin. As this dries up over time, prices must move up to get some of those strong hands to consider selling.
Bitcoin is also coming off of a long wave of fear on the Fear and Greed index. The Fear and Greed index identifies the extent to which the market is becoming overly fearful or overly greedy. Hence why it is called the Fear and Greed Index. Historically when markets reach peaks in fear price is at or near a bottom. We have just gone through one of the longer periods of heightened fear in the Bitcoin market due to the high number of crypto company blow ups in 2022 and the Fed hiking interest rates.

Last but not least we have reserve risk. Reserve risk is a Bitcoin chart that shows the confidence of long-term Bitcoin holders in relation to its price at a given time. The green zone indicates high confidence and low price, presenting an attractive risk/reward ratio for buying Bitcoin. Conversely, the red zone indicates low confidence and high price, making the risk/reward ratio unattractive. Historically buying more heavily in green zones has been optimal if you're trying to get the most amount of Bitcoin possible.
In summary, if you or someone you know is trying to figure out if they should buy an investment property vs more or their first bitcoin the markets could not be in more opposite positions than they are right now. Do with that information as you wish anon.
Thank you for reading. Please give your feedback below!
Subscribe